How OPA values land today
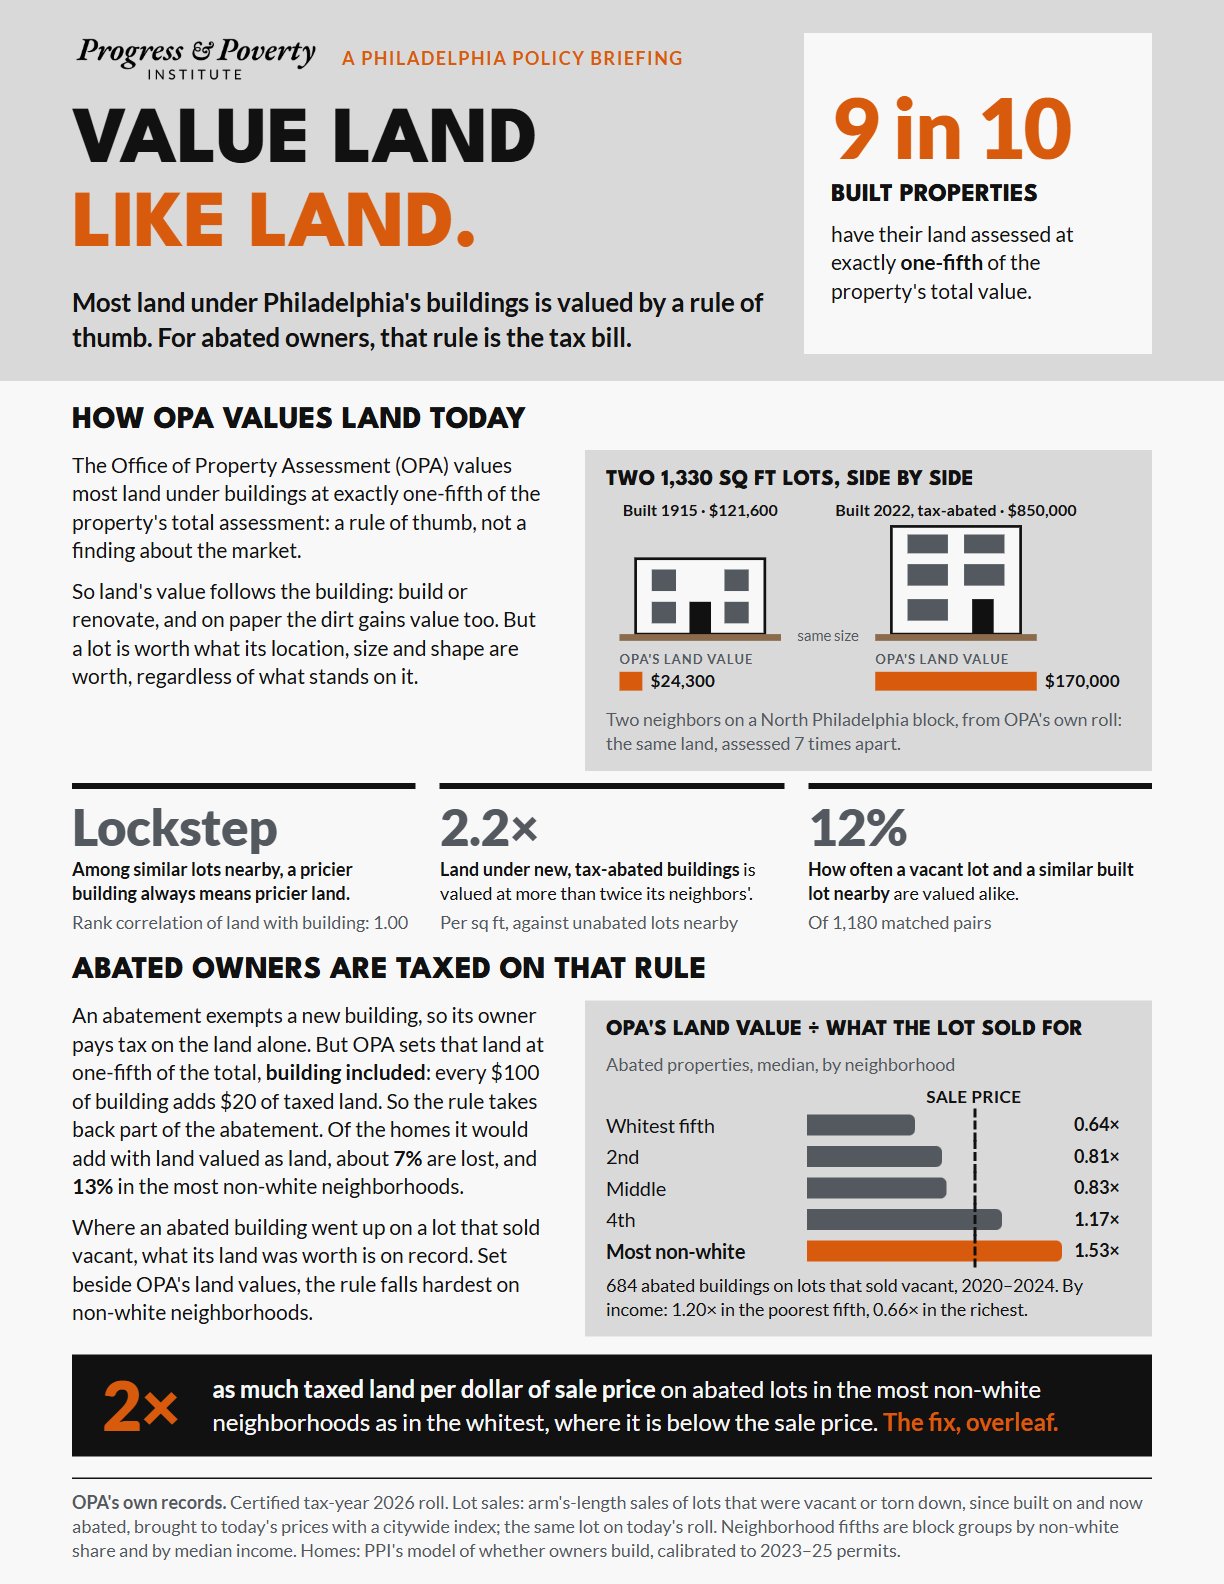
The Office of Property Assessment (OPA) values most land under buildings at exactly one-fifth of the property's total assessment: a rule of thumb, not a finding about the market. Of the 541,000 built properties on its tax year 2026 roll, 9 in 10 have land at exactly one-fifth of the total.1,2
So land's value follows the building: build or renovate, and on paper the dirt gains value too. But a lot is worth what its location, size and shape are worth, regardless of what stands on it.
Among similar lots nearby, a pricier building always means pricier land. Within the same OPA market area and the same quarter of lot sizes, the rank correlation of OPA's land value with its building value is 1.00: the median across 2,218 such groups.2
Land under new, tax-abated buildings is valued at more than twice its neighbors': per square foot, against unabated built lots in the same market area.3,2
How often a vacant lot and a similar built lot nearby are valued alike. Of 1,180 pairs, each a vacant lot and the nearest built lot within 150 meters whose area is within 20% of it, this share have land values per square foot within 10% of each other.2
Abated owners are taxed on that rule
An abatement exempts a new building, so its owner pays tax on the land alone.3 But OPA sets that land at one-fifth of the total, building included: every $100 of building adds $20 of taxed land, as it does on 69% of new abated buildings.2
So the rule takes back part of the abatement. Of the homes it would add with land valued as land, about 7% are lost, and about 13% in the most non-white neighborhoods: 10.2% in the poorest fifth and 2.9% in the richest. That share comes from PPI's model of whether owners build, explained below.2,4
Where an abated building went up on a lot that sold vacant, what its land was worth is on record. Set beside OPA's land values, the rule falls hardest on non-white neighborhoods.5,2
684 abated buildings on lots that sold vacant or as teardowns, 2020–2024. By income: 1.20× in the poorest fifth, 0.66× in the richest. The most non-white fifth's ratio is 2.4 times the whitest's, with a bootstrap 95% interval of 2.0 to 2.7.2
as much taxed land per dollar of sale price on abated lots in the most non-white neighborhoods as in the whitest, where it is below the sale price.
The fix: value land under buildings like vacant land
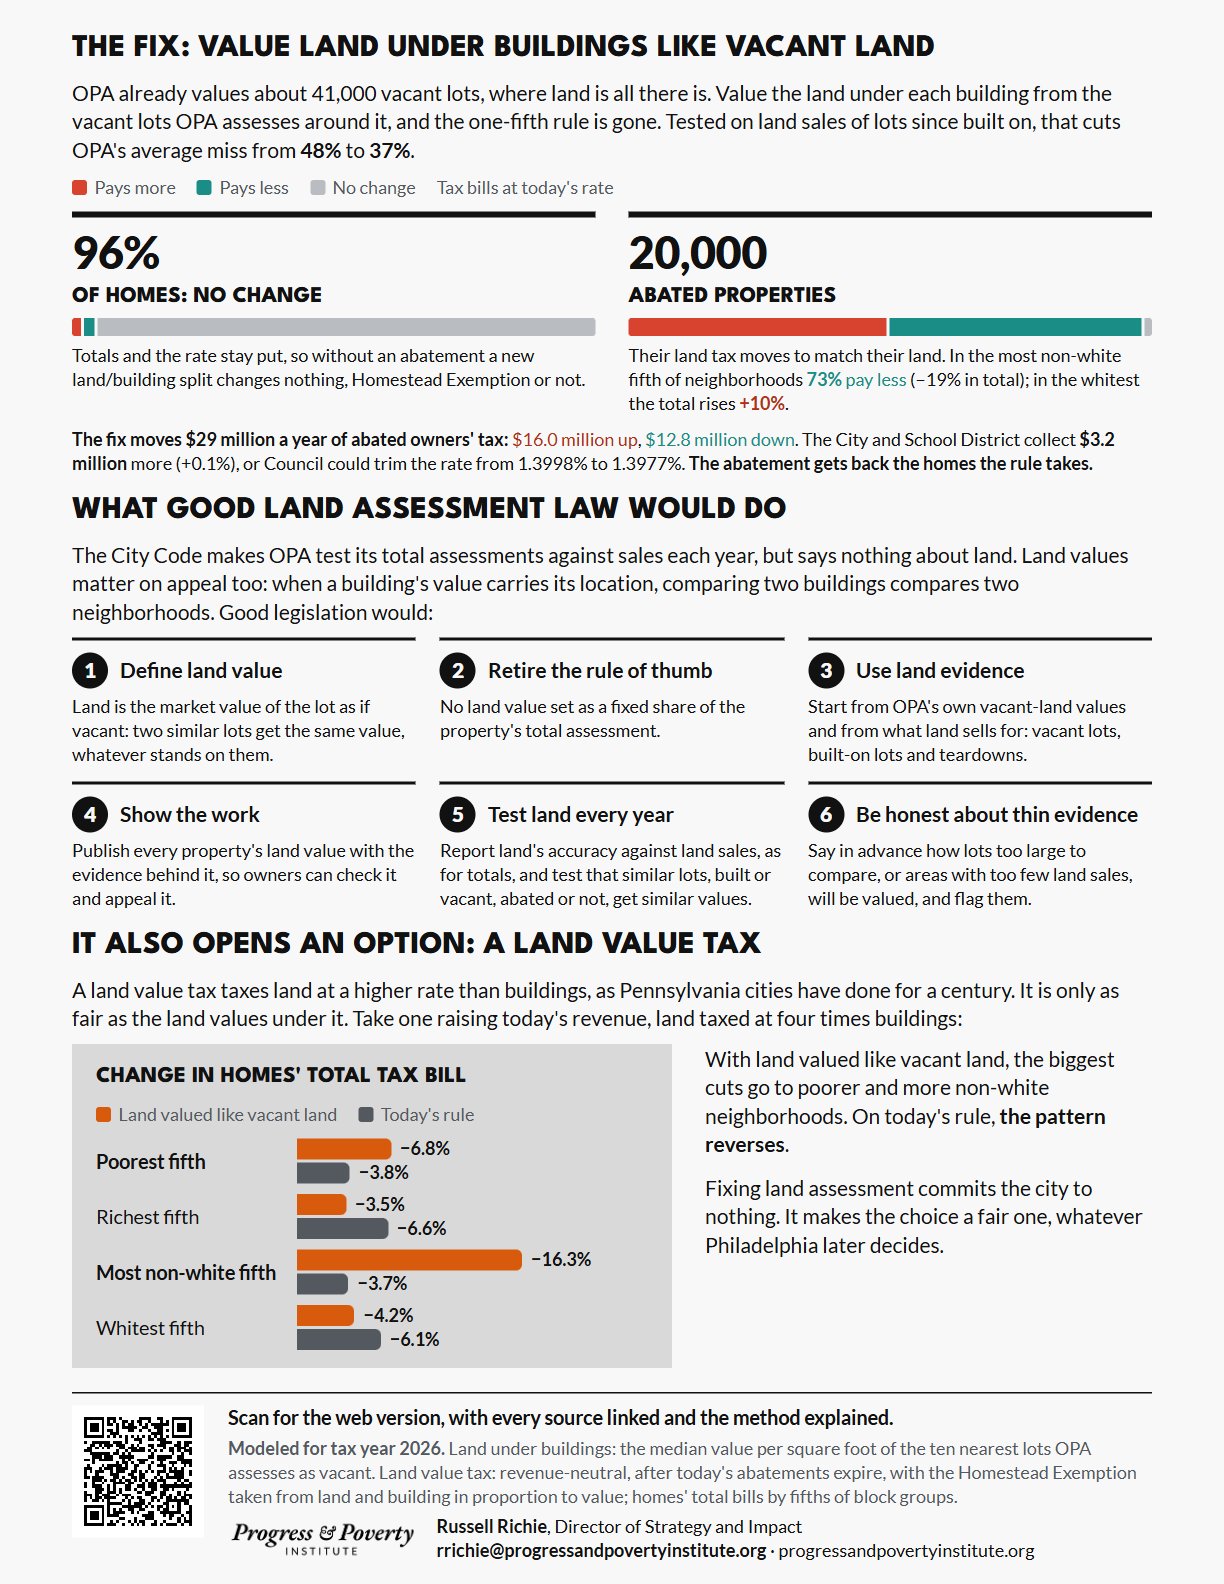
OPA already values about 41,000 vacant lots, where land is all there is.1,2 Value the land under each building from the vacant lots OPA assesses around it, and the one-fifth rule is gone. Tested on land sales of lots since built on, that cuts OPA's average miss from 48% to 37%.2 The average miss is the coefficient of dispersion, the standard measure of how uniformly property is assessed.6
of homes: no change
Totals and the rate stay put, so without an abatement a new land/building split changes nothing, Homestead Exemption or not.7,2
abated properties
Their land tax moves to match their land: 50% pay more and 49% pay less. In the most non-white fifth of neighborhoods 73% pay less (−19% in total); in the whitest the total rises +10%.2
The fix moves $29 million a year of abated owners' tax: $16.0 million up, $12.8 million down (typically +$427 or −$394 a bill), out of $86 million billed to abated property today. The City and School District collect $3.2 million more (+0.1%), or Council could trim the rate from 1.3998% to 1.3977% and collect the same total.8,2 And the abatement gets back the homes the rule takes: about 7% of what it adds, 13% in the most non-white neighborhoods, since the share is measured against this fix.2,4
What good land assessment law would do
The City Code makes OPA set standards for its assessments and test its total assessments against sales each year, but says nothing about land.9,10 Land values matter on appeal too: when a building's value carries its location, comparing two buildings compares two neighborhoods. Good legislation would:
- 1
Define land value
Land is the market value of the lot as if vacant: two similar lots get the same value, whatever stands on them.
- 2
Retire the rule of thumb
No land value set as a fixed share of the property's total assessment.
- 3
Use land evidence
Start from OPA's own vacant-land values and from what land sells for: vacant lots, built-on lots and teardowns.
- 4
Show the work
Publish every property's land value with the evidence behind it, so owners can check it and appeal it.
- 5
Test land every year
Report land's accuracy against land sales, as for totals, and test that similar lots, built or vacant, abated or not, get similar values.
- 6
Be honest about thin evidence
Say in advance how lots too large to compare, or areas with too few land sales, will be valued, and flag them.
It also opens an option: a land value tax
A land value tax taxes land at a higher rate than buildings, as Pennsylvania cities have done for a century.11,12 It is only as fair as the land values under it. Take one raising today's revenue, land taxed at four times buildings, the reform PPI's briefing on a land value tax describes.13
With land valued like vacant land, the biggest cuts go to poorer and more non-white neighborhoods. On today's rule, the pattern reverses.2
Fixing land assessment commits the city to nothing. It makes the choice a fair one, whatever Philadelphia later decides.
Revenue-neutral, after today's abatements expire, by fifths of block groups.2,14
How the numbers are made
Every figure here but one is computed from OPA's own records for tax year 2026, and published with this page as data.2 The exception is the share of homes OPA's rule takes back, from PPI's model of whether owners build, explained below. The bills are modeled estimates, not tax bills, computed parcel by parcel with LVTShift, an open-source property tax toolkit.15
- The records
- OPA's certified roll: one row per parcel, with its land and building values, category, exemptions and abatements.1 "Built properties" are parcels with a building value (541,000 of them). "Abated" means a full or partial construction abatement on the roll.3
- The one-fifth rule
- A built property is counted at the rule when its land, divided by its total assessment and rounded to four decimal places, is one-fifth. 9 in 10 are.
- Lockstep, the abatement premium and matched pairs
- Each compares like with like inside OPA's own market areas. The correlation is taken among built parcels in the same market area and the same quarter of that area's lot sizes, and the figure is its median across those groups. The premium is abated parcels' median land value per square foot over unabated built parcels', in the same market area, and the figure is its median across market areas. The pairs match each vacant lot to the nearest built lot within 150 meters whose lot area is within 20% of its own.2
- What abated lots sold for
- Arm's-length deed transfers5 of lots sold vacant and since built on, or bought as teardowns, validated using OpenAVMKit's sales tools.16 A sale counts only where the same lot, its area within 10%, is on today's roll: 814 lots, 684 of them abated. Each ratio is OPA's land per square foot over the lot's own sale price per square foot, brought to the valuation date with a repeat-sales index: the change in price of the same single-family home sold twice, at least three years apart, across the city, by quarter, leaving out homes first sold while a new building's ten-year tax abatement was running (the buyer pays for the years left, so those pairs would read as slower growth).5 One index for the whole city moves every ratio together, so it can shift their level but not the gradient across neighborhoods. Across the six adjustments tested (this one, pairs held a shorter time, a separate index for each fifth, an earlier valuation date and OpenAVMKit's own index), the most non-white fifth's ratio runs from 0.97× to 2.01× and the whitest's from 0.52× to 0.82×, and the first is 1.6 to 2.4 times the second.2
- Neighborhood fifths
- Census block groups ranked by non-white share of residents and by median household income,14 cut so that each fifth holds a fifth of the city's taxable homes. These are neighborhood averages, not households.
- Land valued like vacant land
- Each built parcel's land is the median value per square foot of the ten nearest lots OPA assesses as vacant, weighted toward the closest, times its lot area. Lots larger than 10,000 square feet, which few land sales test, are scaled by how far the method misses on the sales of such lots. Vacant lots keep OPA's value.2
- The average miss
- Scored on 1,114 sales of lots since built on or torn down, each predicted without the assessment of the parcel that sold. The coefficient of dispersion is the average gap between each value-to-price ratio and the median ratio, as a share of the median,6 here with the most extreme ratios at each end trimmed. Some of these sales may have informed OPA's vacant values, which would flatter this method and OPA's roll alike.
- The bills
- Each built parcel keeps OPA's total assessment, re-split into land and building on the new land value, at today's rate of 1.3998% for the City and School District.8 Because the total and the rate stay put, a bill moves only where the split matters: chiefly abated properties, which pay on land. The Homestead Exemption comes off the total, so a home that only has the exemption keeps its bill.7
- The tax the fix moves
- On each abated property, the bill at today's rate on the new land, against today's bill. Bills that fall and bills that rise are summed separately, so $29 million is the tax that changes hands and $3.2 million is what is left over. On new construction alone, leaving out rehabilitation, it is $22.0 million. The fix misses land sales too (37% on average), so part of that sum is its own error: it is what the fix moves, not a count of what OPA gets wrong.2
- Homes the rule takes back
- PPI's model of whether owners build goes lot by lot through private land where housing is allowed, vacant or worth rebuilding, and asks how likely its owner is to build, with and without today's abatement, and with land valued by OPA's rule (a fifth of the total, a tenth for a newer apartment building of five or more units) or by the fix. How strongly building answers profit is calibrated to the building permits of 2023–25.4 The share is what the abatement adds over 20 years with land valued by the fix, less what it adds under OPA's rule, over the first. The model's two least certain settings, how widely outcomes vary and how strongly building answers profit, move both sides alike, so the share hardly moves with them: 6.7% to 6.9% across the range of variation between owner groups, and 5.9% to 8.4% across every other setting tried one at a time. The number of homes moves far more, so it is not quoted. Under the original abatement, which fully exempted a new building for ten years and when OPA set land at a fifth on apartment buildings too, the rule took back 13.6%. The model credits that abatement with 12.1% of construction on the permits of 2010–2019, well below the 30–40% of development a study for the City found could have been lost or delayed without it.17 A stronger response to the abatement would raise both sides alike and leave the share where it is.2
- The land value tax
- Land taxed at four times the building rate, with the two rates set to raise today's revenue, after today's abatements have run out, and with the Homestead Exemption taken from land and building in proportion to value, which state law would need amending to allow.18 Each chart bar is the change in homes' total bills in that fifth.2
The printed briefing
Two pages, letter size. Download the PDF.
Sources
- City of Philadelphia, Office of Property Assessment, property and assessment data (OpenDataPhilly). opendataphilly.org/datasets/philadelphia-properties-and-a…
- Every figure on this page, as data (numbers.json). numbers.json
- City of Philadelphia, Get a property tax abatement. phila.gov/services/payments-assistance-taxes/taxes/proper…
- City of Philadelphia, Licenses and Inspections building and zoning permits (OpenDataPhilly). opendataphilly.org/datasets/licenses-and-inspections-buil…
- City of Philadelphia, Real Estate Transfers: deed records (OpenDataPhilly). opendataphilly.org/datasets/real-estate-transfers/
- International Association of Assessing Officers, Standard on Ratio Studies: the coefficient of dispersion. iaao.org/wp-content/uploads/Standard_on_Ratio_Studies.pdf
- City of Philadelphia, Get the Homestead Exemption. phila.gov/services/payments-assistance-taxes/taxes/proper…
- City of Philadelphia, Real Estate Tax. phila.gov/services/payments-assistance-taxes/taxes/proper…
- The Philadelphia Code, § 2-305, Office of Property Assessment: its methodology, and standards for its assessments including a limit on the coefficient of dispersion (American Legal Publishing). codelibrary.amlegal.com/codes/philadelphia/latest/philade…
- City of Philadelphia, Office of Property Assessment, Tax Year 2025 residential ratio study. phila.gov/media/20240920162058/opa-tax-year-2025-resident…
- Progress and Poverty Institute, What happened when Pennsylvania taxed land. progressandpovertyinstitute.org/wp-content/uploads/What-h…
- Yang and Hawley, Split-rate taxation: impacts on tax base, Lincoln Institute of Land Policy working paper, 2021 (Table 1: Pennsylvania split-rate municipalities and years). lincolninst.edu/app/uploads/legacy-files/pubfiles/yang_wp…
- Progress and Poverty Institute, Tax land more, tax homes less: a Philadelphia policy briefing. progress-and-poverty-institute.github.io/philly-lvt/
- U.S. Census Bureau, American Community Survey 5-year estimates, 2018–2022, block groups: median household income (B19013) and race and Hispanic origin (B03002). census.gov/data/developers/data-sets/acs-5year.html
- LVTShift, the open-source parcel-level property tax toolkit the bills are computed with. github.com/drussellmrichie/LVTShift
- OpenAVMKit, the open-source mass appraisal toolkit whose sales tools validated and time-adjusted the land sales. github.com/larsiusprime/openavmkit
- JLL for the City of Philadelphia, 10-year tax abatement analysis, 2018. phila.gov/media/20180524153805/City-of-Philadelphia-2018-…
- 53 Pa.C.S. § 8583, homestead exclusion; subsection (c) covers split rates. legis.state.pa.us/WU01/LI/LI/CT/HTM/53/00.085.083.000..HTM